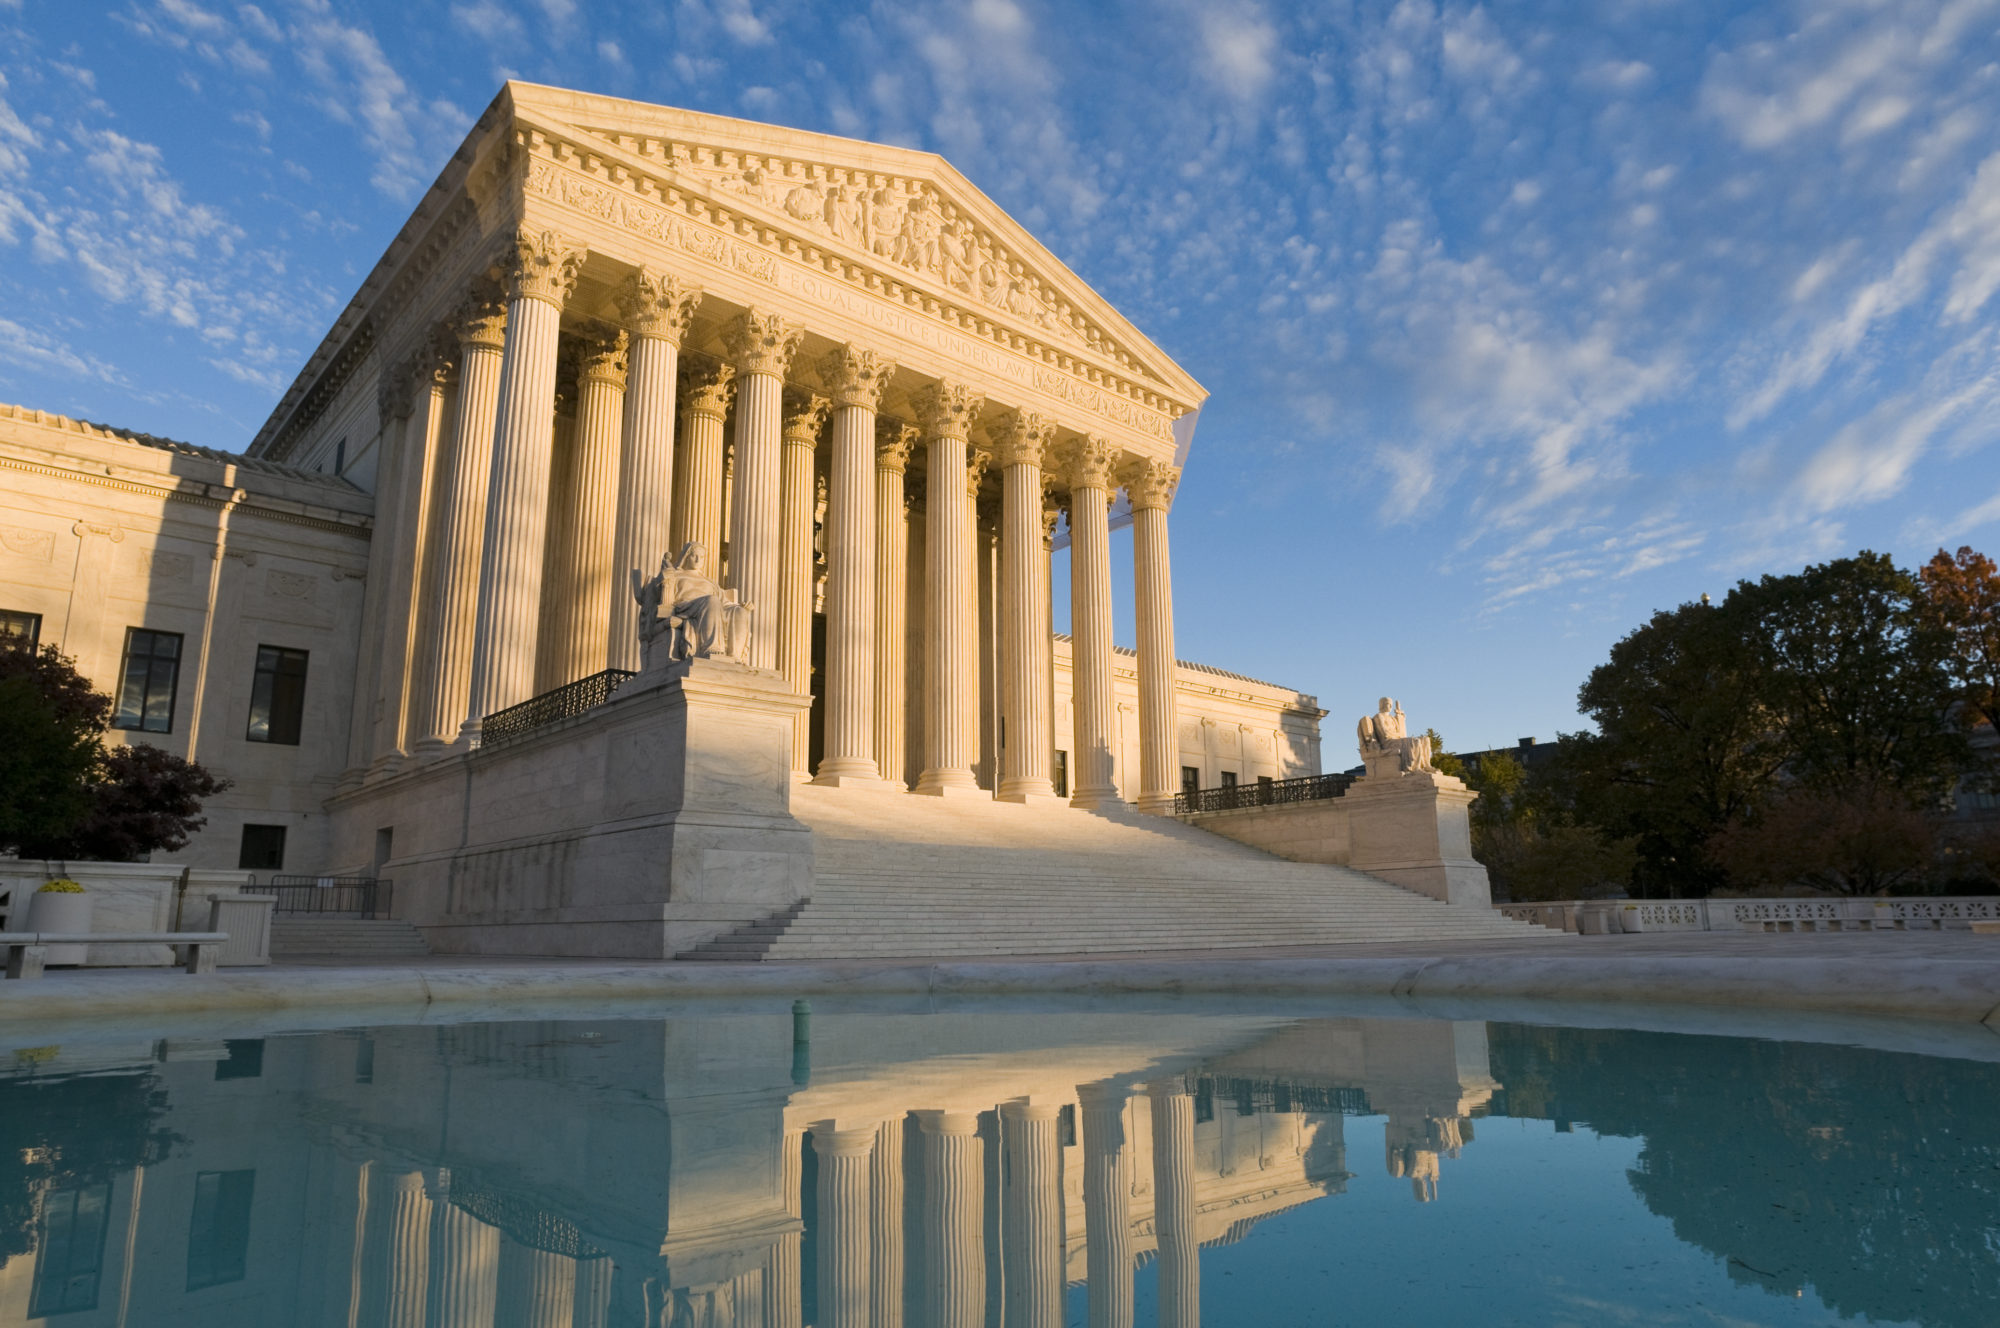


Analysis and Review of U.S. Supreme Court Oral Argument


For a complete explanation of the figures below, see our introductory discussion.
The figure below shows the mean duration of justice-advocate interchanges for all of the five cases heard in the 2020 term to date. Note that the average is conditional on speaking.

The following figure is intended to show the extend to female underrepresented at the Supreme Court bar. It is set up to compare how each female advocate is treated compared to the average for the three men with the most common names appearing in the term to date.
But here’s the kicker (unless we missed something), there were no female advocates in the first week of oral argument. The graph will make more sense as the Term progresses.

The next figure shows how many words were spoken by male and female advocates on average in the 2020 term, to date. Again, it looks a little strange because there were 12 different male advocates and no female advocates.


You must be logged in to post a comment.