As we discussed in last week’s post on predicting Supreme Court votes based on oral argument metrics, on average the justices have much more to say during oral argument to the party they ultimately vote against. Last week we focused on the micro-picture and how this “disagreement gap” could be used to predict the outcomes of cases based on oral argument. It is also worth looking at the longterm trend, and what the disagreement gap tells us about the Court as an institution.
The Disagreement Gap Over Time
The Disagreement Gap Over Time (1955-2017 Terms) [CLICK IMAGE TO EXPAND]The above figure shows the average number of words spoken by each justice per oral argument, differentiated on the basis of whether the justice ultimately voted for or against the position of the advocate. That is, whether the justice ultimately agreed or disagreed with the side that the advocate was arguing. The average number of words in agreement per case in any given year is indicated by the hollow black circles. Likewise, words in disagreement are represented by the solid red circles. The gray area shows the confidence interval for words in agreement and the light bluearea does the same for words in disagreement.
We divided the data into two time periods: from the 1955 to 1994, and from 1995 to 2017. The shaded regions shows the 95% confidence interval for the trendline in each period. The division of the data between before and after the 1995 Term comports with the theory and findings in our forthcoming article, The New Oral Argument, that much of the increase in judicial activity during oral argument can be attributed to broader trends in political polarization, which escalated dramatically after the Republican Revolution in the 1994 Congressional election.
The figure above clearly shows that although a small disagreement gap has been a feature of Supreme Court oral argument for some time, the size of the gap drastically increased in the mid-1990s. Since the mid-1990s, the justices are now significantly favoring their “friends” over their “foes.”
The Disagreement Gap in the 2017 Term
The New Oral Argument examined 60 years of data, from 1955 to 2015. Now we are going to examine whether the disagreement gap applies evenly to all the justices. We focus on the recent 2017 Term, the first full term with Justice Gorsuch and without Justice Scalia.
The first two columns in the table below indicate the disagreement gap for each justice in the 2017 Term, in terms of words and speech events. The third and fourth columns show words and speech events in disagreement as a percentage of the total for each justice.
Justice
Average Disagreement Gap
Percent of Disagreement
(Words)
(Speech Events)
(Words)
(Speech Events)
Thomas
0
0
0
0
Kennedy
10
0.7
52%
54%
Breyer
151
2.0
59%
55%
Sotomayor
147
3.2
61%
56%
Ginsburg
79
1.6
63%
58%
Kagan
158
1.1
63%
53%
Roberts
126
1.3
64%
53%
Alito
162
3.7
69%
64%
Gorsuch
147
4.1
70%
64%
Every single justice who spoke in the 2017 Term follows the pattern that we identified, of speaking less to the side that he or she ultimately agreed with. Only Justice Thomas is truly evenhanded, by speaking not a word to either side.
Yet there is significant variation even among the eight speaking justices. If the justices were as easy to read at the poker table as they are in oral argument, then you would rather be on a table with Justices Gorsuch and Alito than with Justices Thomas and Kennedy. Gorsuch does not just follow the trend that we identified prior to his arrival on the Court: he personifies it. Justice Gorsuch shows the largest difference in number of speech episodes directed at each side; in the average case, he directed about 5.5 questions or comments to the side he voted with and 9.5 to the side he voted against. Another way to look at this is that Gorsuch and Kennedy each spoke an average of slightly over 100 words to the side they voted for, but whereas Kennedy spoke almost as many words to his foes, Gorsuch had more than twice as much to say to the side he voted against.
It is not surprising that Justice Gorsuch fits the disagreement gap pattern so well. We identified this effect as a product of partisan polarization, and Gorsuch was appointed in a climate of extreme political polarization in Congress, in an era in which the public is more polarized than ever.
Court watchers and interested parties pay close attention to the ebb and flow of oral argument in individual cases. Usually the best way to understand oral argument is to read the briefs and listen to the argument, but there is also mounting evidence that a more quantitative approach is useful in predicting the votes of individual justices and, ultimately, case outcomes. A big data approach allows for analysis that is not possible in a case by case analysis: for instance, it is not feasible to listen to every case in order to discern what historical trends are emerging in judicial behavior since 1955.
The disagreement gap
In our forthcoming article, The New Oral Argument: Justices As Advocates, we show that the justices overwhelmingly tend to have more to say to the party they ultimately vote against. Sarah Shullman made this suggestion in 2004 based on a study of cases from the 2002 Term; John Roberts came to the same conclusion in a 2005 article before he was appointed to the Bench; and Johnson, et al, among others revisited the issue in 2009.
In The New Oral Argument we show that this disagreement gap has been a feature of Supreme Court oral argument since at least the 1960s but that the size of the gap ballooned in the mid-1990s and has been increasing ever since. We also have a number of other metrics, taking into account more granular data including word counts, interruptions, and the difference between questions and comments, all of which we show follow patterns that help predict case outcomes.
Reduction to practice
Our disagreement gap analysis in the figures below shows the difference between the number of times each justice spoke to counsel for petitioner and counsel for respondent. Because being spoken to more often is actually a very bad sign for the advocate, we then invert those numbers so that a positive score reflects a gap favoring the petitioner (dark navy bars) and negative scores favor the respondent (red bars). Those bars reflect not only speech episodes to each side, but the ratio of questions to comments, patterns of interruptions, and other factors. We also indicate uncertainty or a “weak signal” from the data where appropriate (gray bars). The actual votes of the justices in these cases are indicated on the right-hand side of the figure.
In preparation for this year’s Supreme Court IP Review at the Chicago Kent Law School, Professor Ed Lee asked us whether there was anything interesting to report from the oral argument data for last term’s patent cases. We thought it was a great opportunity to test out some predictive models we have been working on, by applying our metrics to last Term’s intellectual property cases, and seeing if the outcomes could have been predicted based on their oral arguments.
WesternGeco LLC v. ION Geophysical Corp
Prediction based on oral argument in WesternGeco v. ION Geo [CLICK TO ENLARGE]In WesternGeco v. ION the Court held 7-2 that lost profits in overseas markets attributable to patent-infringing exports are recoverable in patent litigation. Our model correctly predicted that Justices Gorsuch and Breyer would vote in favor of the respondent and that Justices Kennedy, Sotomayor, Alito and Kagan would vote in favor of the petitioner. The WesternGeco analysis highlights how useful the model can be in predicting outcomes that don’t fall along traditional liberal-conservative fault-lines, such as the Breyer-Gorsuch coalition.
SAS Institute Inc. v. Iancu
Prediction based on oral argument in SAS Institute Inc. v. Iancu [CLICK TO ENLARGE]In SAS Institute v. Iancu, the Court held 5-4 that when the Patent Trial and Appeal Board institutes inter partes review of a party’s challenges to the validity of an issued patent, it must make a decision on all of the patent claims contested by that party. The majority arrived at this conclusion by holding that that the word “any” meant “every” in the relevant statute. In SAS Institute, our model correctly predicted the votes of all of the justices except for the habitually silent Justice Thomas. Given the liberal-conservative divide evident in the eight speaking justices, we would have predicted that Justice Thomas would vote with the conservative majority in favor of the petitioner.
Oil States Energy Services, LLC v. Greene’s Energy Group
Prediction based on oral argument in Oil States v. Greene’s Energy [CLICK TO ENLARGE]In Oil States, the Court rejected a constitutional challenge to the system of inter partes review introduced in the 2011 patent reform legislation, the America Invents Act. Oil States is the most intriguing of the three cases because so much rested on the outcome of the case and because, as seen below, our predictive model misread Justice Breyer’s eventual vote. Earlier this year, we were engaged as paid consultants and asked to predict the outcome of Oil States.
After reading the briefs, listening to the argument, and crunching the numbers, we predicted a 7-2 vote in favor of the respondent, with Justice Breyer concurring. Happily, this proved to be the exact outcome. Understanding the issues in the case and the substance of Justice Breyer’s comments and questions, we were confident that our model was misleading in this particular instance. However, the model was extremely useful in helping us to read the intentions of Justices Alito and Kennedy.
Patterns are not rules, and so even a very accurate metric will not accurately predict every judicial vote in every case. Hence in Oil States, we adjusted the empirical prediction in accord with what we heard of Justice Breyer’s tone. But by analyzing trends and patterns, we are able to go beyond impressionistic accounts in predicting case outcomes. The proof will be in the pudding, so check in here for our forecasts, and check back to see how they line up with the ultimate case outcomes.
Beyond Judge Kavanaugh’s potential to shift doctrine and policy to the right, the Kavanagh nomination represents a watershed moment in the history of the Supreme Court as an institution. If Kavanagh is confirmed, the Court will be perfectly polarized along partisan lines: all four liberal justices will have been appointed by Democrat presidents, and all five conservative justices will have been appointed by Republican presidents. As Neal Devins and Lawrence Baum explored in their 2016 article, Split Definitive: How Party Polarization Turned the Supreme Court into a Partisan Court, broader political polarization has turned the Supreme Court into a far more partisan institution. According to Devins and Baum, the 2010 Term heralded a new era of polarization when the liberal-voting Justice Stevens, appointed by Republican President Ford, was replaced by Justice Kagan. Yet even then, the Court was not yet perfectly polarized because on a few key issues, such as gay rights and capital punishment, Justice Kennedy sometimes voted in coalition with the more liberal justices and against the position of the Republican party. If Justice Kennedy is replaced by Judge Kavanaugh, we can expect close to perfect polarization on the Court. What effect will such polarization bring to the Court?
In our forthcoming article, The New Oral Argument: Justices as Advocates, we show that there has already been significant impact from partisan polarization and we suggest that the effect of perfect polarization will likely be considerable. The polarization on the Court follows from the massive political polarization in Congress, which greatly accelerated in the mid-1990s after the Republican Revolution in Congress and contributed to congressional dysfunction. Elite political polarization soon translated into polarization among the public, which created public animosity and division. The Supreme Court is far from immune: we show that political polarization was associated with an increase in the justices behaving as advocates during oral argument.
One manifestation of such advocacy is that the justices are far more active at oral arguments, taking up considerably more of the time previously reserved for the advocates to make their cases. The following figure shows how that increased dramatically around 1995, as the country became more polarized.
Click on the image to enlarge
Average number of words spoken by the justices per case (1970-2017 Terms)
The figure shows the average number of words spoken by the justices per case in each Term before and after 1995. The shaded region shows the 95% confidence interval for the trendline in each period. There was a slight upward trend before 1995, but a far more significant discontinuity in the mid-1990s is evident on the graph, indicating that there was a large jump in the mid-1990s, when the average number of words spoken went from around 2000 before 1995 to closer to 4000 after 1995. This finding is supported by more sophisticated multivariate regression analysis, controlling for other variables. We conducted the same analysis to assess changes in the amount of time the justices speak: of the standard 60 minute oral argument, since 1995 the justices are taking up an additional 13 minutes on average.
Average number of questions and non-questions by the justices (1960-2015 Terms)
In the figure, the solid navy circles represent the average number of questions asked by the justices per case each Term at oral argument. The solid red circles represent the number of comments made by the justices on average per case. As can clearly be seen, the number of questions remained largely constant from 1960 to 2015, despite the massive increase in the number of words spoken by the justices. In contrast, the number of comments by the justices vastly increased, rising from approximately 100 per case to over 150 per case by 1995, and has reached close to an average of 200 per case by 2015. Once again, the shaded 95% confidence intervals indicate a clear and significant upward shift in the mid-1990s.
In The New Oral Argument, we argue that the more justices behave like advocates (i.e., presenting conclusions rather than asking questions), the more they will be perceived to have prejudged the issues in the cases presented to them. This threatens to undermine the Court’s legitimacy and the public’s faith in the Rule of Law. No one can know with certainty what will happen if Kavanaugh joins the Court—it is possible that he may bring a different approach or tone to Supreme Court arguments that will change the increasingly divided culture. However, given that his appointment would begin an era of expected perfect polarization, that seems unlikely. Political scientists and public surveys have shown that polarization leads to acrimony and divisiveness, due to a lack of middle ground and consequent inability to form a common consensus. This is particularly true among educated elites, such as Supreme Court justices. It is unsurprising, then, that the push to install a candidate with views far outside the mainstream has been controversial. That controversy is unlikely to fade away if Judge Kavanaugh joins a highly divided Supreme Court.
For a case to reach the U.S. Supreme Court, it should present a difficult question of law. The Supreme Court is not the ultimate arbitrator of fact but rather the apex court with the responsibility of determining the most pressing questions of doctrine. Reflecting this, the justices give priority to cases that represent circuit splits in the lower courts. Accordingly, it is unsurprising that in about 60% of cases at least one justice dissents. But the distribution of dissenting votes is far from uniform. Who dissents the most at the Court?
Click Image to Expand
Dissent Rate for All Justices, 1955 – 2017 Terms
The figure above shows the justices ranked by their relative percent of dissenting votes. On the Roberts Court, Justice Ginsburg dissents the most often, followed closely by Justice Thomas. At the lowest end of the spectrum lies Justice Kennedy, followed by Chief Justice Roberts.
Overall rate of dissent rate is not same as the number of dissents. Ginsburg, for example, has a dissent rate of 19.55% for her 25 terms on the Court. During this time she decided 2092 cases, 1664 in the majority and 409 in dissent. Ginsburg’s dissent rate is slightly ahead of Thomas’ (18.96%), but with his two year head start, he actually has more total dissents (442). Neither Ginsburg nor Thomas are anywhere near Justice Stevens’ 1054 dissents at an average of 24.69%.
The big picture pattern that emerges is straightforward: Justice Ginsburg is the most extreme liberal on the current Court, Justice Thomas the most extreme conservative; Justice Kennedy was the Roberts Court median, and he is expected to be replaced in that role by the Chief. Looking to previous eras, the same pattern holds: Justice Douglas was the most extreme justice on the Court since Martin and Quinn started measuring judicial ideology, followed by Justice Marshall (although Justice Harlan was somewhat more moderate). And not only were the other lowest dissenters, Justices Goldberg and Powell, also Court medians, but along with Justice Kennedy, all three were “super medians”— justices who dominated the center of the Court.
This is not a coincidence: the dominant measure of judicial ideology, the Martin-Quinn scores, hinge on dissenting as a sign of extremism. Essentially, the scores are based on the idea that the more often a justice dissents alone, the more extreme he or she is likely to be; the more often a justice votes with other justices, the less extreme he or she is likely to be. Moderates tend to find common ground with others, extremists do not. Consequently, looking at dissent rates over time reveals interesting insights into the changing dynamics of the Court.
Click Image to Expand
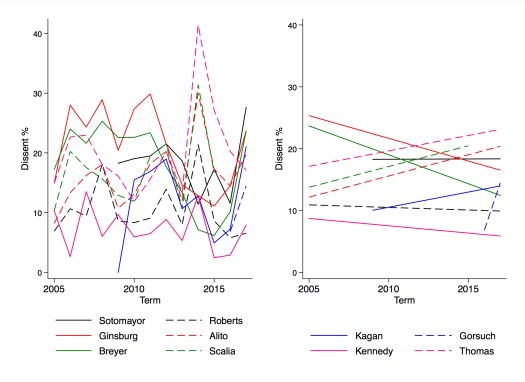
Dissent Rates Over Time During the Roberts Court (2005-2017 Terms) (Term-by-term on the left, Linear fit to show long term trend on the right)
The above figures both show the dissenting rates for each justice over time—the figure on the left shows the full variation for each, the figure on the right shows the trend for each justice over time. It is clear that while Justice Ginsburg has the highest rate of dissenting on the Roberts Court, that has not been true for the last five years. Both she and Justice Breyer have dissented less in recent years, while at the same time Justices Scalia, Thomas, and Alito have increased their rates of dissent. This conclusion adds to the significance of the reputedly more consistently conservative Judge Kavanagh potentially replacing Justice Kennedy: we can expect a resurgence in dissents from the justice so often celebrated for her dissents, Justice Ginsburg.
The reason is clear: Justice Kennedy sided more with the liberal justices in recent years than previously. This occurred frequently enough that in the 2014, 2015, and 2016 Terms— although not in his final term— Justice Kennedy measured as negative, i.e. slightly liberal in historical terms, whereas previously he had always registered as moderately conservative. The zero threshold is somewhat artificial but Kennedy’s relative liberal decision-making in his final years is reinforced by the increasing dissent rate of Justices Scalia, Thomas, and Alito. The lack of a similar pattern by the Chief supports the view that this is a product more of the changing agenda of the Court than any actual change in preferences by Kennedy prior to his retirement—it seems that the Court was taking more cases where moderate conservatives have more in common with liberals than with extreme conservatives.
The limit of ideological measures is that they are based on judicial votes in cases by Term—thus they are both retrospective, knowable only after the justices have determined case outcomes, and are also generalized trends. But we know that the justices sometimes vote contrary to their ideology, so to predict case outcomes, ideally we would have ex ante case-specific information, rather than ex post Term-level information. And this is where oral arguments come in.
The justices’ dissenting behavior follows a pattern discernible not only from long-term trends, but also from individual case behavior: how much they speak at oral argument. The following table shows the trend for the Roberts Court; the same pattern has been shown to apply for previous courts.
Words Spoken in Majority and Dissent on the Roberts Court
Justice
Words in Majority (average)
Words in Dissent (average)
Dissent-Majority Difference
Dissent-Average Difference
Gorsuch
313
514
201
66
Thomas
57
203
146
87
Souter
581
715
133
104
Alito
323
441
117
86
Scalia
592
677
84
72
Kennedy
320
384
63
64
Kagan
553
607
54
35
Breyer
823
874
51
34
Stevens
282
329
46
30
Roberts
542
580
38
38
Ginsburg
430
455
25
27
Sotomayor
536
546
9
-11
The above table shows the average number of words used by each justice per case at oral argument when the justice is ultimately in the majority once the case is determined, and when ultimately in dissent. The difference for every justice is positive: justices consistently speak more when they will ultimately dissent in the case. When normalized for the amount of words each justice speaks on average per case, the difference is positive for every justice except for Justice Sotomayor. As such, with one exception, if you want to know whether a justice is likely to dissent in a case, you need only listen carefully to how much they talk at oral argument and compare it to how often they ordinarily talk. The most talkative justices will, on average, be those who ultimately dissent. This comports with the more general trend we have shown that the “losers of history”—be it in the case at hand or in terms of long-term dominance of the Court—tend to be more active at oral argument than those on a winning streak.
In this way, as in others previously explored, oral arguments can constitute a preview of case outcomes, including which justices will dissent. This is particularly helpful when we have less information from other sources. As we have previously cautioned, analysis of Justice Gorsuch’s behavior has to be particularly careful because of his short service on the Court. The first figure suggested that Justice Gorsuch may be less conservative than expected, sitting as he does in his initial rate of dissent between Chief Justice Roberts and Justice Alito. But his high level of difference in activity level when dissenting versus when in the majority puts him in a far more extremist company, with strongly conservative Justices Thomas, Alito, and Scalia, as well as Justice Souter, who, despite being appointed by a Republican, was almost as liberal as Justice Ginsburg.


You must be logged in to post a comment.